The Tool That Makes You Stop Talking
I teach a concept in my A-CSM classes called Level 3 listening. Level 1 is internal listening - you’re hearing the words but mostly thinking about what you’re going to say next. Level 2 is focused listening - you’re genuinely tracking the other person. Level 3 is global listening - you’re picking up on body language, energy shifts, what’s not being said, the dynamics in the room that nobody has named yet.
Most teams never get past Level 1 with their users.
They build features based on what stakeholders requested. They refine stories based on acceptance criteria that a product owner wrote from memory. They ship increments that are technically correct and emotionally disconnected from the humans on the other end.
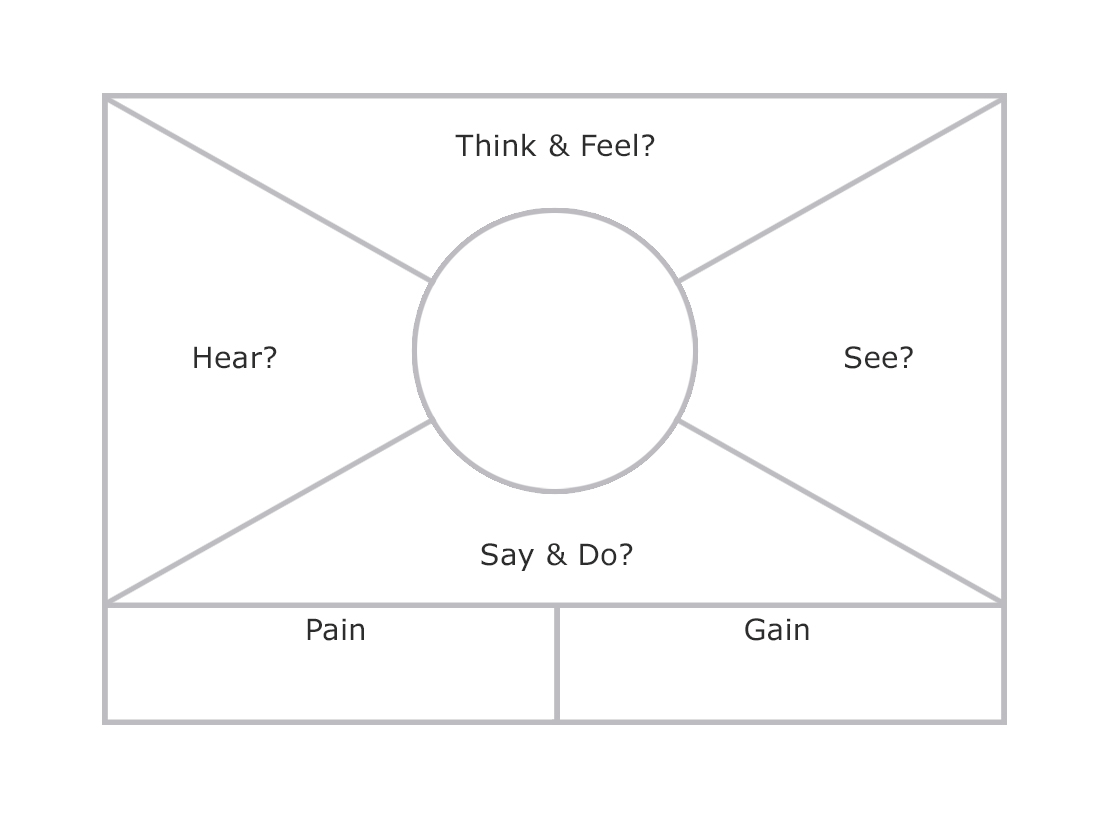
The Empathy Map is a deceptively simple tool that interrupts this pattern. It’s a single-page visual canvas divided into quadrants - what a person says, thinks, feels, and does - plus sections for their pains and gains. That’s it. No scoring rubric, no complicated methodology, no certification required. Just a structured way to pause and ask: “What’s it actually like to be this person?”
Dave Gray created the Empathy Map in 2009 at XPLANE, the visual thinking consultancy he co-founded. He published it more broadly in Gamestorming: A Playbook for Innovators, Rulebreakers, and Changemakers (2010), co-authored with Sunni Brown and James Macanufo. The book is full of visual facilitation techniques, but the Empathy Map is the one that escaped into the wild.
Gray updated the canvas in 2017 to its current form, adding a “Goal” section and reorganizing the layout. If you’ve seen different versions floating around - some with “Hear” and “See” as separate quadrants, some without pains/gains - that’s why. The 2017 version is the one I use.
Here’s why I keep reaching for it as a coaching tool: it forces a team to externalize their assumptions about another human being and spread them out where everyone can see them. And the moment those assumptions become visible, they become challengeable.
The Canvas - Four Quadrants and Two Bookends
The Empathy Map looks simple enough that people sometimes underestimate it. A rectangle divided into four sections, with a person’s head sketched in the center and two additional sections along the bottom. But each section does specific cognitive work, and skipping any of them leaves gaps that will come back to haunt your product decisions.
Let’s walk through it.
Goal
At the top of the updated canvas: what is this person trying to accomplish? What decision do they need to make? What task are they trying to complete?
This anchors everything else. Without a clear goal statement, the quadrants become abstract character sketches instead of actionable insights. “A first-year teacher preparing for parent-teacher conferences” gives you something to work with. “Teachers” does not.
(A common facilitation mistake: letting the team skip this step and jump straight into the quadrants. The result is a nice-looking poster that doesn’t connect to any specific moment in the user’s experience. Pin down the goal first.)
Says
What does this person actually say out loud? Direct quotes are ideal - pull from interview transcripts, support logs, or verbatim feedback. If you’re working from collective knowledge, capture what the team has heard users say in meetings, demos, or calls.
The key is literal language, not paraphrases. There’s a meaningful difference between “Users want faster performance” and “I clicked the button and went to get coffee because I knew it would take forever.” The first is an abstraction. The second is a human being telling you about their day.
Thinks
What might this person be thinking but not saying? This is where the team exercises genuine empathy - projecting themselves into someone else’s inner experience.
This quadrant surfaces the gap between public statements and private concerns. A teacher might say “I’m excited about the new curriculum software” while thinking “This is the fourth platform switch in three years and I’m exhausted.” Those are very different signals, and a product built on only the public statement will miss the real problem.
The tension between Says and Thinks is where the most valuable insights live. If they match perfectly, either the team knows their users exceptionally well or they’re not thinking hard enough.
Feels
What emotions is this person experiencing? Not what they should feel, not what the team hopes they feel - what they actually feel.
This is the quadrant that makes engineers uncomfortable (in my experience, anyway). Feelings are fuzzy. They resist quantification. They don’t fit neatly into Jira fields. But they drive behavior more reliably than any rational analysis, and ignoring them is how teams build products that are technically sound and humanly alienating.
Name the emotions specifically. “Frustrated” is a start. “Frustrated because she spent 20 minutes looking for a feature that used to be on the dashboard and is now buried three clicks deep” - that’s something you can actually act on.
Does
What actions and behaviors does this person exhibit? What workarounds have they built?
This quadrant is the reality check. People say and think all kinds of things - but what they do reveals what actually matters. A user who says they want advanced reporting but spends 90% of their time in the basic dashboard is telling you two different stories. The behavioral one is usually more reliable.
Watch for workarounds especially. When someone has built a spreadsheet to track something your software is supposed to handle, that’s a neon sign pointing at a gap between your product and their reality.
Pains
Along the bottom left: what frustrations, obstacles, fears, and risks does this person face? What keeps them up at night (related to the goal you defined at the top)?
Pains are not feature requests. “We need a mobile app” is a feature request. “I can’t check project status when I’m walking between classrooms and I end up blindsided in meetings” is a pain. The first tells you what to build. The second tells you why - and “why” opens up solution spaces that the feature request might have closed off.
Gains
Bottom right: what does success look like for this person? What would make their life meaningfully better?
Gains aren’t always dramatic. Sometimes the most powerful gain is “I don’t have to think about this anymore.” If your tool handles something reliably enough that it disappears from someone’s mental checklist, you’ve given them back a piece of their attention - and attention is the scarcest resource most people have.
Why This Matters for Agile Teams
You might be looking at those quadrants and thinking, “This is a UX research tool. What does this have to do with agile coaching?” Fair question.
Here’s my answer: the most common dysfunction I see in agile teams isn’t technical. It’s empathetic. Teams that can’t feel what their users feel consistently build the wrong thing - not because they’re incompetent, but because they’re building from their own mental model instead of their user’s lived experience.
Every team carries assumptions about their users. Most of those assumptions have never been stated, let alone tested. The Empathy Map makes them tangible. When a developer writes “Thinks: this software is intuitive” on a sticky note, and a support engineer immediately says “Actually, we get fifteen tickets a week from people who can’t find the export button” - that’s a collision between assumption and reality that would never have happened inside someone’s head.
That’s why I use it in coaching. Not because it’s a UX tool (though it is), but because it’s an alignment tool. It gets an entire team looking at the same representation of the same human being and negotiating a shared understanding.
Personas are useful - I’m not here to trash them. But a persona is a description. An Empathy Map is a thinking exercise. A persona document lives in Confluence and gets referenced occasionally. An Empathy Map session happens in real time, with the whole team actively building a shared mental model together. The artifact is useful, but the conversation is the point.
Here’s where it gets practical. Run an Empathy Map session for your primary user before your next refinement cycle. Pin the completed canvas where the team can see it. Then, as you refine each story, ask: “Does this address a real pain? Does it move this person toward a real gain?” You’ll be surprised how many stories don’t survive that filter - not because they’re bad ideas, but because they were built from assumptions rather than reality.
Understand the person, then build the thing. Not the other way around.
Facilitating an Empathy Map Session
Running an Empathy Map session is one of the easiest facilitation exercises you can lead. The barrier to entry is low, the time investment is modest, and the payoff is almost always worth it. Here’s how I do it.
Setup
You need a large canvas - whiteboard, butcher paper, or a digital equivalent like Miro or FigJam. Sticky notes and markers for in-person sessions. Timer visible to everyone.
Invite the whole cross-functional team. Not just the product owner and designers - engineers, testers, anyone who touches the product. The support engineer knows things the architect doesn’t. The QA person has seen failure modes that reveal user frustrations the product owner has never heard about. You need all of those perspectives in the room.
The Session Flow
1. Define the person and the goal (5 minutes). Be specific. Not “our customer” - a particular person in a particular situation. Name them. State the goal. Write it at the top of the canvas.
2. Silent brainstorm - all four quadrants (8-10 minutes). Everyone writes sticky notes simultaneously, one idea per note. Silent work is critical. If people start discussing immediately, the loudest voice shapes everything and you lose the diversity of perspective that makes this exercise valuable.
(Tip: if you’re doing this remotely, use a timer and mute everyone. Seriously. The silence is doing the work.)
3. Place and share (10-15 minutes). Go quadrant by quadrant. Each person places their notes and briefly explains. No debate yet - just listen and cluster similar ideas. You’re building a shared picture, not arguing about it.
4. Discuss tensions and gaps (10-15 minutes). This is the gold. Look for contradictions between Says and Thinks. Look for nearly empty quadrants. Ask: “What surprised you? Where do we need real data instead of guesses?”
5. Fill in Pains and Gains (5-10 minutes). Now that the quadrants have primed the team’s thinking, populate the bottom sections.
6. Identify implications (5-10 minutes). Which pains map to backlog items? Which gains are we not addressing? Are there stories we should write - or kill?
Total time: 45-65 minutes
One hour or less, and the team walks out with a shared understanding of their user that’s richer than anything they had walking in.
A Few Facilitation Notes
Keep the scope tight. One person, one goal, one session. If you try to map three user types in a single session, you’ll get shallow maps of all three instead of a deep map of one.
Watch for projection. When an engineer writes “Thinks: I wish this had an API” - gently ask whether that’s the user thinking or the engineer thinking. It’s a kind question, not a gotcha, and it usually gets a laugh followed by a more honest sticky note.
Revisit the map. An Empathy Map created once and never updated is a snapshot of assumptions at a point in time. The good ones get revised after user interviews, usability tests, and support ticket reviews. Tape it to the wall and keep fresh sticky notes nearby. Let it evolve.
What It Looks Like in the Room
Jess had been a Scrum Master at a mid-size edtech company for about a year. Her team built the teacher-facing side of a learning management system - assignment creation, student progress tracking, parent communication. The engineering was strong. The sprints were predictable. By most agile metrics, the team was performing well.
The problem was that teachers kept leaving the platform.
Churn data showed it: teachers would adopt the system at the start of a school year, use it actively for two or three months, then gradually stop logging in. By spring, usage dropped by nearly half. The product owner, Raj, had a theory - the platform needed more features. Gradebook overhaul. Google Classroom integration. Parent communication portal.
The team had spent two quarters building exactly those features. Churn hadn’t budged.
Jess pitched an Empathy Map session to Raj as “one hour to pressure-test our assumptions before we commit to Q3.” He was skeptical but agreed. An hour was cheap.
She set up the session for the full team - four engineers, Raj, UX designer Mei, and Brooke from customer support. Jess drew the canvas on the whiteboard, wrote “Ms. Rivera - 4th grade teacher, mid-year, trying to keep up with grading and parent communication” at the top, and handed out sticky notes.
The first ten minutes of silent brainstorming produced a thick spread of notes. When they started placing them quadrant by quadrant, the patterns emerged fast.
Says was full of what the team expected: “I need better reports.” “The gradebook is clunky.” “Can you integrate with Google Classroom?” These were the feature requests the team had been building against for months.
Thinks was where things got interesting. Brooke from support had written: “Thinks: I don’t have time to learn another feature I’ll use twice.” And: “Thinks: If I spend time on this and it changes again next year, I’ve wasted my evening.” Mei, the designer, added: “Thinks: My principal chose this, not me.”
Feels landed hard. “Overwhelmed.” “Guilty about not using the tools she was told to use.” “Anxious that parents will judge her response time.” One of the engineers - Tomasz - wrote something that changed the entire conversation: “Feels: like she’s managing software instead of teaching kids.”
There was a long pause after that one went on the board.
Does brought the behavioral data. Brooke shared what she saw in support tickets: teachers logging in on Sunday nights to batch-process a week’s worth of updates. Copying data from the LMS into personal spreadsheets because the export didn’t match what their school required. Emailing parents directly instead of using the platform’s messaging feature because it was three clicks fewer.
The gap between Says and Does was enormous. Teachers were saying they wanted more features. They were doing everything they could to use fewer features, faster, with less friction.
Raj stared at the board for a while. Then he said something that Jess later told me was the turning point of the quarter: “We’ve been building for the teacher who asks for features at a demo. We haven’t been building for the teacher at her kitchen table at 9 PM on a Sunday trying to get through her grading before the week starts.”
The Pains section almost filled itself after that. Time poverty. Context-switching between five different school tools. The guilt of falling behind on a system her administration mandated. The fear that parents would see delayed responses and draw conclusions about her dedication.
The Gains section shifted too. The team had been listing gains like “comprehensive reporting” and “seamless integrations.” After the session, the gains were: “Feels like the grading is just done.” “Doesn’t have to think about which tool to use.” “Gets her Sunday evening back.”
Over the next two weeks, the team restructured their Q3 roadmap. The gradebook overhaul stayed - but reframed entirely. Instead of adding features, they stripped the grading workflow to a three-click path for the most common use case. They built a “quick grade” mode that felt more like flipping through a stack of papers than navigating an application. They replaced the parent messaging feature with auto-generated weekly updates from data already in the system - no teacher action required.
Raj killed the Google Classroom integration. Not because it was a bad idea, but because it would add another settings screen, another setup step, another thing for a Sunday-night teacher to configure.
By the end of Q3, the team had shipped less total functionality than any previous quarter. Churn dropped by thirty percent.
At the retrospective, Tomasz said it best: “We finally stopped building for the teacher in the demo and started building for the teacher in the kitchen.”
Jess kept the Empathy Map on the wall next to the team’s Kanban board. New sticky notes appeared regularly as Brooke shared things from support calls. Before every refinement, someone would ask, “Is this a Sunday night problem or a demo day problem?” The stories that addressed Sunday night problems moved to the top.
That’s what a good Empathy Map does. It gives the team a shared conscience - a reference point that pulls every conversation back to the question that actually matters: “What is it like to be this person, right now, trying to do this thing?”
Common Mistakes and How to Avoid Them
I’ve facilitated enough of these to have a highlight reel of failure modes. Here are the ones I see most often.
Mapping a demographic instead of a person. “Small business owners” is not specific enough. “Dana, a bakery owner in her second year, trying to figure out whether she can afford a part-time assistant” - that’s someone the quadrants can work with. If your goal statement reads like a market segment definition, start over.
Filling it in alone. An Empathy Map created by one person is just that person’s assumptions organized neatly. The value comes from multiple perspectives colliding. You need the support engineer and the architect.
Treating it as a deliverable instead of a conversation. If the session ends and someone says “Great, I’ll clean this up and put it in Confluence,” the most valuable part already happened and won’t transfer. The artifact is a reminder. The alignment happened in the room.
Skipping the tensions. The contradictions between quadrants are the whole point. If your map is internally consistent and contradiction-free, you’ve built a flattering portrait instead of a truthful one.
Never updating it. An Empathy Map is a hypothesis about another human being. Hypotheses should be tested and revised. The first version is always the least accurate one.
Where It Connects
The Empathy Map plays well with frameworks you’re probably already using.
Design Thinking. The map is a core artifact of the empathize phase. Fill it in from research, use it to frame “How Might We” questions, and your ideation sessions will be grounded instead of speculative.
User Story Mapping. Jeff Patton’s technique organizes the backlog around user activities and goals. An Empathy Map provides the emotional context that story maps often lack. Use the story map for the what and the Empathy Map for the why.
Jobs to Be Done. Clayton Christensen’s framework asks what “job” the user is “hiring” your product to do. The Empathy Map’s goal statement aligns directly - and the pains and gains sections map neatly to the forces that push users toward or away from switching behaviors.
Retrospectives. Here’s one that surprises people: you can use an Empathy Map for internal stakeholders too. Before a tough conversation with leadership, map the VP who keeps asking for fixed timelines. What does she say? What does she think? What pressures is she under that the team can’t see? Understanding her perspective doesn’t mean agreeing with her - but it might change how you frame the conversation. (I’ve used this more times than I can count, and it almost always reduces the adversarial energy.)
Emotional Intelligence. The Empathy Map is essentially emotional intelligence made tangible and collaborative. If your team scores high on technical skill and low on interpersonal awareness, this is one of the gentlest entry points.
Go Deeper
-
Gray, D., Brown, S., & Macanufo, J. (2010). Gamestorming: A Playbook for Innovators, Rulebreakers, and Changemakers. O’Reilly Media. The original source. Chapter on Empathy Maps is concise and practical.
-
Gray, D. (2017). “Updated Empathy Map Canvas.” Medium. Dave Gray’s own explanation of the 2017 revision - why he changed the layout, what each section is for, and how to facilitate a session. The definitive reference for the current version.
-
Bland, D.J. & Osterwalder, A. (2019). Testing Business Ideas. Wiley. Includes Empathy Maps as part of a broader toolkit for validating business assumptions. Good for teams that want to connect empathy work to business model thinking.
-
Patton, J. (2014). User Story Mapping. O’Reilly Media. Pairs exceptionally well with Empathy Maps - use the map for emotional context, the story map for activity structure.
-
XPLANE. xplane.com. Dave Gray’s visual thinking consultancy, where the Empathy Map originated.
Use of Dave Gray and XPLANE’s material does not imply endorsement from XPLANE. Empathy Map is copyright 2009 XPLANE, used with permission under a Creative Commons Attribution-NonCommercial-NoDerivs license.