The Most Productive-Looking Unproductive Team I’ve Ever Coached
I once sat down with a VP of Engineering who was genuinely proud of her staffing model. She walked me through it on a whiteboard — color-coded, well-organized, clearly a lot of thought had gone into it. Seven engineers, four active projects. Each engineer assigned to at least two projects, some to three. “We’re fully utilized,” she said. “Nobody’s sitting idle.”
She was right. Nobody was sitting idle. Everybody was busy. The team had been busy for six months.
They had also delivered almost nothing.
Not because they weren’t talented. Not because the projects were poorly defined or the requirements were unclear. But because what looked like full utilization on a resource spreadsheet was, in cognitive reality, a slow-motion productivity collapse. Every engineer on that team was spending so much of their mental energy on the overhead of switching between projects that the actual work — the thinking, the problem-solving, the deep engagement that software development requires — had barely any headspace left to happen in.
This is the central finding of Gerald Weinberg’s work on project switching, buried in plain sight in Volume 1 of Quality Software Management, published in 1992. Weinberg — one of the most influential thinkers in software engineering, and a man who had been watching programmers work since the 1950s — included a table that I have pulled out in probably forty coaching conversations. It is one of those findings that is simple enough to fit on a napkin and devastating enough to reframe an entire staffing discussion in the time it takes to read it.
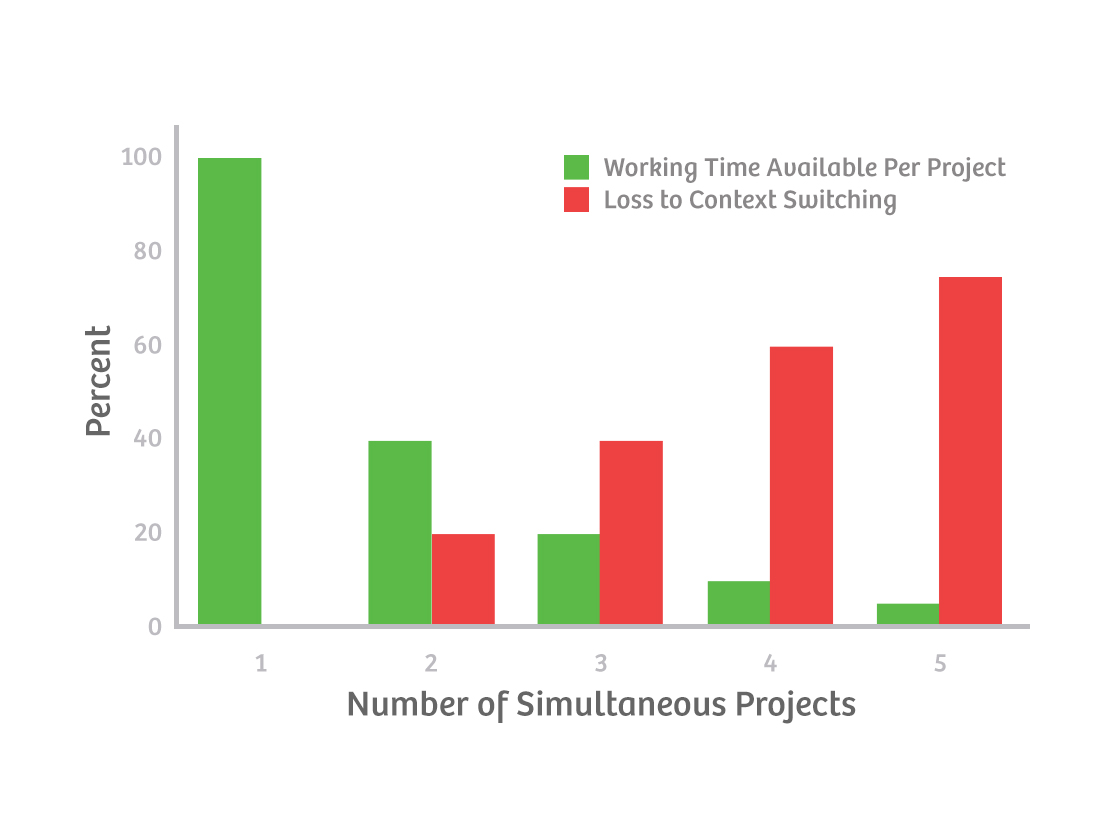
The table shows the relationship between the number of simultaneous projects a person is assigned to and the percentage of their time that is actually productive — total, across all projects combined. Not theoretical capacity. Not scheduled hours. Actual productive time remaining, after accounting for the overhead that switching between projects imposes. One project: roughly one hundred percent productive time. Two projects: about eighty percent remaining — you’ve already lost twenty percent of your working day to the overhead of switching, leaving eighty percent to split across both. Three projects: seventy-five percent remaining, with twenty-five percent lost to context switching. Four projects: sixty percent. Five projects: thirty-five percent remaining — meaning sixty-five percent of your working day, for a person assigned to five projects, goes to overhead. Sixty-five percent. Gone.
The VP looked at the table for a long moment. Then she said, “But we’re not actually losing that time. People are still working.”
“On what?” I asked.
The silence that followed was the coaching.
The Mechanism: Why Switching Costs More Than You Think
The intuition most managers have about multi-project assignment is that time distributes linearly. If someone is assigned fifty percent to Project A and fifty percent to Project B, they’ll give fifty percent of their capacity to each. The cognitive science says otherwise — emphatically.
Weinberg’s Numbers and Why They’re Worse Than They Look
Let me say something important about the Weinberg table that often gets lost in the summary: the numbers are conservative.
Weinberg derived his estimates empirically, from observing real software teams over decades of consulting. He wasn’t running a controlled experiment in a psychology lab — he was watching programmers actually work. When he says that two concurrent projects leave you with eighty percent productive time remaining, he means that for a typical software developer working on two things simultaneously, the overhead cost of maintaining context across both projects — remembering where you were, what you were trying to do, what the dependencies are, what decisions you made last week and why — consumes approximately twenty percent of your working capacity. That eighty percent then gets divided between the two projects. Every day.
But here’s what the table doesn’t fully capture: the distribution of that overhead is not uniform across the day. Switching events are expensive. Each time you put down one project and pick up another — even if you’re doing it at a scheduled transition point — you pay a cost at the moment of the switch that is substantially higher than the steady-state overhead of keeping context alive. You have to rebuild the mental model. You have to reconstruct the state of the work. You have to remember what you were doing and what you were going to do next.
For a complex codebase, a coaching relationship, or a strategic initiative, this reconstruction can take anywhere from ten minutes to several hours — depending on the complexity of the context and how long you’ve been away. Weinberg’s numbers average across these switching events. On days when someone has to switch multiple times, the actual productive output can fall even further than the table suggests.
The second thing the table doesn’t fully capture is the compounding effect. Cognitive overhead is not just time lost at the moment of switching. It is sustained degraded performance for a period afterward. You are not back at full capacity the moment you’ve reconstructed context. Your attention is partially still on what you just left.
Which brings us to why we know this in such precise terms.
Weinberg's Project-Switching Cost Table (from Quality Software Management, Vol. 1, 1992):
1 project: ~100% productive time. ~0% lost to switching overhead.
2 projects: ~80% productive time remaining. ~20% lost to switching overhead.
3 projects: ~75% productive time remaining. ~25% lost to switching overhead.
4 projects: ~60% productive time remaining. ~40% lost to switching overhead.
5 projects: ~35% productive time remaining. ~65% lost to switching overhead.
A person assigned to five concurrent projects is spending roughly two-thirds of their working day not working. They are maintaining the appearance of work while accomplishing a fraction of what they would accomplish if focused.
Attention Residue: The Half of Your Brain You Left Behind
In 2009, organizational psychologist Sophie Leroy published research that gave the phenomenon Weinberg had been observing a precise cognitive name: attention residue.
Leroy’s finding, published in Organizational Behavior and Human Decision Processes, was this: when you switch from Task A to Task B, a portion of your cognitive attention remains on Task A. Not metaphorically — measurably. People who switched tasks with high engagement on an incomplete first task performed significantly worse on the second task, not because the second task was harder but because part of their cognitive processing was still running on the first one.
The key variable Leroy identified was completion. If you leave Task A at a natural stopping point — genuinely done with a phase, with a clear mental model of where it stands — the attention residue is lower. If you leave it in the middle, unresolved, with threads hanging, the residue is higher. Your brain keeps processing. It keeps trying to close the loop. And while it’s doing that, it’s not fully available for the work in front of you.
Now apply this to a developer who is context-switching between a legacy API migration and a new feature build three times a day. They are never fully on either project. They are always partially on both — one project generating attention residue while they’re nominally working on the other. Their output on both projects suffers, and neither they nor their manager is likely to correctly attribute the shortfall to the switching itself. The manager sees someone who is working. The developer feels like they’re working. But the cognitive bandwidth that would otherwise be going to deep problem-solving is quietly being consumed by the background processing of things that aren’t done.
This is why the experience of multi-project work often feels exhausting in a way that’s hard to articulate. It’s not just that there’s more to do. It’s that the brain is never fully present anywhere.
The Ramp-Up Tax
There is a third cost that Weinberg gestures at but that has gotten more attention in recent years: the ramp-up tax.
Complex knowledge work — software development, coaching engagements, strategic planning — does not live in short-term memory between sessions. When you come back to a project after a few days away, you are not resuming from exactly where you left off. You are rebuilding. You are reconstructing the mental model of the problem space, re-reading recent decisions and their rationale, re-establishing which threads are live and which are resolved.
This reconstruction is not free. Estimates from software engineering research suggest that an experienced developer switching back to a codebase they were actively working in a week ago may need thirty minutes to an hour to fully reorient — and that’s with good documentation and commit history. A more complex system, or a longer gap, means more time. A coaching engagement with a team requires rebuilding emotional context, relationship dynamics, the state of ongoing conversations, what was agreed and what is still open. A strategic initiative requires re-loading market context, stakeholder positions, decision history.
Every switch event includes a ramp-up payment at the beginning and — as Leroy shows — an attention residue cost at the end. The productive time in the middle is shorter than the schedule suggests.
The Organizational Incentive Trap
Here is the part of this conversation that makes some managers uncomfortable, and which is worth naming directly.
Organizations that assign people to multiple simultaneous projects are not usually doing it because they have thought through the cognitive costs and decided the trade-off is worth it. They are doing it because their mental model of knowledge work is inherited from manufacturing — and in manufacturing, splitting a worker’s time between two production lines does roughly distribute their output between both lines. The industrial logic of utilization optimization makes sense in that context.
It does not make sense for knowledge work, where the product is not physical and the resource is not muscle but cognitive bandwidth. But the mental model persists, because it is legible. A spreadsheet showing every engineer at one hundred percent allocation looks good. It looks efficient. It looks like management is doing its job.
What it obscures is that utilization and productivity are not the same thing in knowledge work. High utilization of a cognitive resource does not mean high output. It often means the opposite — it means the resource is so busy switching contexts that it cannot enter the sustained, focused states that actually produce the outputs that matter.
There is also an accountability dynamic that keeps multi-project assignment in place even when the costs are visible. If a project fails to deliver, it is easier to explain if “we only had fifty percent of the team’s time” than if “we had the team’s full attention and still missed.” Multi-project assignment provides a built-in excuse for underdelivery — which means it is actually in the interest of some managers, consciously or not, to keep it in place.
The result is organizations that are, in Weinberg’s framing, systematically and predictably producing less than they could — while looking busy.
What This Changes About Your Coaching
Making the Case for Dedicated Teams
When you’re working with an organization that is consistently failing to deliver on its project portfolio, multi-project assignment is one of the first things to look at. The presenting symptom is usually described as a capacity problem — “we don’t have enough people” — but the diagnosis often turns out to be an allocation problem.
The Weinberg table is your primary tool here, and it works best when you let the numbers do the talking before you offer any interpretation. Write the table on a whiteboard. Ask the room to count how many simultaneous projects each engineer is assigned to. Then let them do the math themselves.
The conversation that follows is usually more productive than the one you’d get from a theoretical discussion about focus and flow, because the math is concrete. If you have eight engineers each assigned to three projects, you’re effectively paying for the equivalent of twelve full-time engineers and getting the throughput of roughly six — because forty-five percent of your capacity is being consumed by switching overhead. That’s the equivalent of two engineers working full-time on nothing.
Some managers will push back on the Weinberg numbers — they’re thirty-plus years old, they’re estimates, real teams are different. That’s fair. Engage the pushback. Even if you argue the numbers down by half — even if you think the overhead is only ten percent per project instead of twenty-five — the math still doesn’t work. You are still losing significant productive capacity to context switching. The direction of the effect is not in dispute.
The coaching move is to propose a time-limited experiment: pick two projects from the portfolio, dedicate a small team fully to one for four to six weeks, and measure throughput against the baseline from the multi-project period. The results almost always speak more clearly than the theory.
Kanban WIP Limits as Cognitive Protection
Weinberg’s table explains, at the individual and project level, what WIP limits explain at the task level in Kanban. They are the same mechanism operating at different scales.
WIP limits work because every item in progress is an open loop — an unfinished task generating attention residue and consuming cognitive bandwidth. Limiting work in progress is not primarily a flow optimization (though it has flow benefits). It is an act of cognitive protection. It is the team deciding that they will not impose more context-switching overhead on themselves than is necessary to do the work well.
When you’re introducing WIP limits to a team that is skeptical, the cognitive science angle often lands better than the flow mechanics. Flow diagrams and throughput calculations can feel abstract. “Your brain can’t actually work on three things simultaneously — it just switches between them very fast, and every switch costs you” is a direct description of the team’s daily experience. People recognize it immediately.
The connection to Weinberg is useful here too: WIP limits at the task level prevent the within-project context switching that compounds the between-project overhead. A team that is protected from multi-project assignment but still maintains fifteen items in progress on their sprint board has solved the organizational problem while recreating the cognitive problem at a smaller scale. Both levels matter.
Coaching Individuals and Managers on Capacity Planning
One of the most common coaching conversations I have is with individuals who describe feeling overwhelmed, scattered, and unproductive — despite working long hours. The first question I ask is not about time management or prioritization. It is: how many active projects do you have right now?
The answer is almost always more than two. Often it is four or five. And when you explain the Weinberg table — not as an indictment, but as a description of what their brain is actually doing — there is usually a moment of recognition. The exhaustion they’re feeling is not a character flaw. It is the cognitive cost of context switching, and it is higher than most people intuit.
The coaching from there is practical: what would it take to finish one project to a natural stopping point before picking up the next? What would it take to make a deliberate, explicit choice about sequencing rather than accepting every concurrent assignment by default? Sometimes the answer is that they can’t control their assignments — it’s an organizational constraint. In that case, the coaching moves to managing attention residue: building transition rituals, writing explicit “where I left off” notes before switching, blocking time for ramp-up rather than assuming they’ll just pick up where they were.
For managers, the coaching is different. The goal is to shift the mental model from utilization to throughput. High utilization of a cognitive resource is not the same as high output. A team at seventy percent allocation on a single project often delivers more in a month than a team at one hundred percent allocation spread across three. The goal is not to keep everyone busy. The goal is to ship.
What It Looks Like in the Room
Nadia had been a delivery coach at a consultancy for four years when she got the engagement that changed how she thought about organizational throughput. The client was a regional bank — about eight hundred people in technology — with a project portfolio that had been, by their own admission, in a permanent state of “mostly almost done” for two years.
The CTO, a methodical man named Ethan, had already tried most of the standard interventions. They’d adopted SAFe. They’d run agile training for team leads. They’d hired two additional program managers. The portfolio board looked organized. The quarterly business reviews looked optimistic. And nothing was finishing.
Ethan’s theory was that they didn’t have enough senior engineers. He wanted Nadia’s help making the case to the board for headcount.
Nadia spent her first week observing. She attended standups, looked at the portfolio board, and had one-on-one conversations with eight engineers at various seniority levels. By the end of the week, she had not confirmed the headcount hypothesis. She had found something else entirely.
The median engineer at this bank was formally assigned to three projects. Several were assigned to four. One senior architect — the person Ethan had identified as their most critical technical resource — was on six. Not because anyone thought this was optimal. Because every project needed him, and because saying no to a project request was politically difficult, and because the staffing model had been inherited from the previous CTO and nobody had examined it directly.
Nadia brought Weinberg’s table to her check-in with Ethan. She’d drawn it on a single sheet of paper, which she slid across his desk without commentary.
Ethan read it. He was quiet for longer than most people are quiet when they read it for the first time.
“You’re telling me we’ve been paying for eight hundred engineers and getting the output of maybe four hundred.”
“I’m telling you the math suggests your switching overhead is significant enough that headcount may not be the primary constraint,” Nadia said carefully. “More engineers assigned to more projects in the same way gives you more overhead, not more throughput.”
Ethan leaned back. “How do I prove this internally? Because I can already hear the pushback. ‘Weinberg’s from 1992.’ ‘Our engineers aren’t that bad at multitasking.’ ‘We’re different.’”
This was the conversation Nadia had been preparing for. She didn’t try to defend Weinberg’s specific numbers — she didn’t need to. She asked Ethan to pick two projects from the current portfolio: one that was important, one that was nearly done but had been “nearly done” for three months. Then she proposed an experiment.
For six weeks, they would dedicate a team of five engineers — fully, no other assignments — to finishing Project B, the nearly-done one. No other work. No exceptions without explicit escalation. They would track throughput (stories completed per week) against the baseline from the previous quarter, when those same five engineers had been distributed across four projects each.
Ethan approved it, partly because it was time-limited and partly because Project B’s continued non-completion was becoming a political problem with the business unit waiting on it.
Six weeks later, Project B was done. Fully done. Not “mostly done” — deployed, accepted, in production, the team had moved on.
The throughput numbers were striking. The dedicated team had completed ninety-three percent more work per engineer per week compared to the baseline period. Not twice as much time — they’d worked the same hours. Ninety-three percent more output from the same people in the same calendar time, because they weren’t spending half their cognitive bandwidth rebuilding context and managing open loops across four simultaneous projects.
Ethan took the numbers to his next leadership team meeting. He didn’t need Nadia in the room for that conversation.
What stayed with Nadia from the engagement wasn’t the throughput improvement — she’d expected something in that range. It was the debrief conversation she had with the five engineers afterward. One of them, a developer named Reza who had been at the bank for six years, said something she wrote down.
“I forgot what it felt like to finish a thing. We’ve been in progress on everything for so long. This last six weeks — I actually felt like an engineer again.”
That’s what Weinberg’s table is really measuring. Not just throughput. The human cost of being perpetually split between things that never complete.
Go Deeper
-
Weinberg, G.M. (1992). Quality Software Management, Vol. 1: Systems Thinking. New York: Dorset House. The source of the project-switching cost table and the foundational text on applying systems thinking to software development. The table appears in Chapter 1, but read the whole book — Weinberg’s observations about how managers misread software systems are as relevant now as they were in 1992.
-
Leroy, S. (2009). “Why Is It So Hard to Do My Work? The Challenge of Attention Residue When Switching Between Work Tasks.” Organizational Behavior and Human Decision Processes, 109(2), 168–181. The peer-reviewed study that named and documented attention residue. If you want the cognitive science underpinning for why Weinberg’s numbers look the way they do, this is the paper to read.
-
Newport, C. (2016). Deep Work: Rules for Focused Success in a Distracted World. New York: Grand Central Publishing. Newport’s treatment of the conditions required for complex cognitive work — sustained focus, minimal context switching, protected time for difficult thinking — is the practitioner-facing translation of what Weinberg and Leroy show empirically. Particularly useful for coaching individuals who are trying to protect their own capacity.
-
Anderson, D.J. (2010). Kanban: Successful Evolutionary Change for Your Technology Business. Sequim, WA: Blue Hole Press. The foundational Kanban text. Anderson’s case for WIP limits is grounded in flow theory and Little’s Law, but it dovetails directly with the cognitive science here — WIP limits protect against the same switching costs that Weinberg documents at the project level.
-
DeMarco, T. & Lister, T. (1999). Peopleware: Productive Projects and Teams (2nd ed.). New York: Dorset House. DeMarco and Lister documented the human side of software productivity long before “flow” became an agile buzzword. Their chapters on interruption, environment, and focused work are a direct complement to Weinberg — same era, same empirical orientation, same conclusion from a different angle.